Building pod-logger from scratch
I am Kaiwalya Koparkar, founder of Geek Around Community, a GitHub Campus Expert, MLH Coach, Open-Source Advocate & DevRel. I work as a Program Manager/ Community Manager in several communities. I love to speak at sessions, workshops, meetups, and conferences. In the past year, I have won over 10+ hackathons and mentored/judged/participated in over 35+ global hackathons.
In this blog, I’ll take you through the complete journey of building a multi-container application that displays Kubernetes pod logs using a Go backend, a web frontend, and a dashboard built with Builder.io. The idea started small: fetch and display logs from running pods. But as I explored more, I realized the scope was larger, and it had the potential to be a full-fledged logging utility. The project taught me how to work with the Kubernetes API, create RoleBindings for access, and manage communication between containers using Nginx and proper service configurations. I faced several scope-related challenges, especially trying to balance between MVP and scalable design from day one. Instead of building everything in a monolith, I broke it into clean services—frontend (dashboard), backend. Each component had its own build process and was automated using GitHub Actions and Docker Hub. Let’s explore the building blocks step by step.
Understanding Multi-Container Setup and the Role of Volumes
When working with Kubernetes, splitting components into multiple containers provides modularity, cleaner deployment, and fault isolation. In my case, the Go-based backend was responsible for talking to the Kubernetes API and fetching logs, while the frontend container displayed the logs in a simple browser interface. Volumes played a key role in this setup, not for sharing application state but for persisting logs between restarts. When the backend fetched logs, they could be optionally saved to a mounted volume for easy backup or future parsing. This structure also opened possibilities for adding sidecars in the future to handle tasks like log parsing or storage. Multi-container pods ensure shared networking and volume space, making communication and data exchange between containers easier. Instead of exposing services externally for container-to-container communication, they can directly interact through shared localhost or volumes. It’s one of the best practices in Kubernetes for tight coupling and internal service dependencies.
Using the Kubernetes API from Inside the Container
Accessing the Kubernetes API securely from inside a pod required some configuration. Initially, I tried to directly call the API server using curl, but I faced authentication issues and SSL errors. After reading this guide, I realized that I needed a ServiceAccount, Role, and RoleBinding to enable secure access. I used a Go script to call Kubernetes APIs, relying on the token mounted inside the pod at /var/run/secrets/kubernetes.io/serviceaccount. This helped authenticate the API requests correctly. I also had to adjust the script’s environment variables using Docker’s ENV configuration instead of relying on shell scripting within the pod. The curl commands still didn’t work initially, but I fixed them using insights from another blog. Once these fixes were done, the Go backend was able to pull logs from pods successfully, proving that my setup and permissions were correct.
Creating the Backend in Go with a Command Executor
The first backend version was a simple Go program that ran a shell command and displayed its output on the /api/logs endpoint. To test the basic idea, I used the ls command inside the container and displayed the results on a webpage. This gave me confidence that the API server could run shell commands and serve output dynamically. Later, I replaced the ls command with actual Kubernetes API calls using the Go client SDK to fetch pod logs. I implemented routes /api/namespaces and /api/pods?namespace=X to allow users to list available namespaces and pods dynamically. The backend followed a basic RESTful structure, returning JSON for each API call. Error handling was added to gracefully return messages when the API was unreachable or the pod log was not found. This created a reusable base that I could later expand upon for more advanced log inspection features.
Frontend in HTML, Bootstrap, and JavaScript
To make the logs viewable, I built a very lightweight frontend using HTML, Bootstrap, and plain JavaScript. It called the Go API endpoints and displayed the responses in a browser interface. The design was kept minimal to ensure fast load times and simplicity. Initially, I ran the frontend locally using python3 -m HTTP server, but that wasn’t scalable. So, I containerized it using Nginx, added a Dockerfile, and set up proper routing to make calls to the backend using cluster IPs. Relative URLs were updated to reflect container-to-container communication using service names defined in Kubernetes. I also added a refresh button that would fetch the latest logs without reloading the whole page. This small interaction made the frontend feel much more dynamic and usable.
Automating the Build with GitHub Actions and Docker Hub
To keep things easy, I automated the container build process using GitHub Actions. Each push to the main branch would trigger a workflow to build the Go backend and frontend containers, tag them with both latest and version numbers, and push them to Docker Hub. I configured secrets for Docker Hub credentials in GitHub to avoid leaking sensitive data. The same workflow also handled tagging using Git commands to ensure consistent version tracking. This meant I could test changes locally with Docker Compose and push them confidently knowing the images were versioned correctly in the registry. With the new images available, I could then update my Kubernetes manifests and redeploy the containers quickly. Automation reduced human error and helped maintain consistency across environments.
Bringing It All Together with Docker Compose
To make testing easier before deploying to Kubernetes, I created a docker-compose.yml file that defined all three services: the Go backend, the frontend with Nginx. Each container had its own port, and the compose file handled network communication between them. This setup allowed me to run the entire application with a single docker-compose up command, making local development and testing significantly faster. I mapped ports to localhost so I could hit the endpoints and browser frontend from my laptop. The logs being pulled from Kubernetes were now shown in the browser in real-time. With this working setup, I could validate the entire end-to-end pipeline from Kubernetes API to user interface. Docker Compose was particularly helpful during early prototyping and debugging phases before moving everything into a cluster.
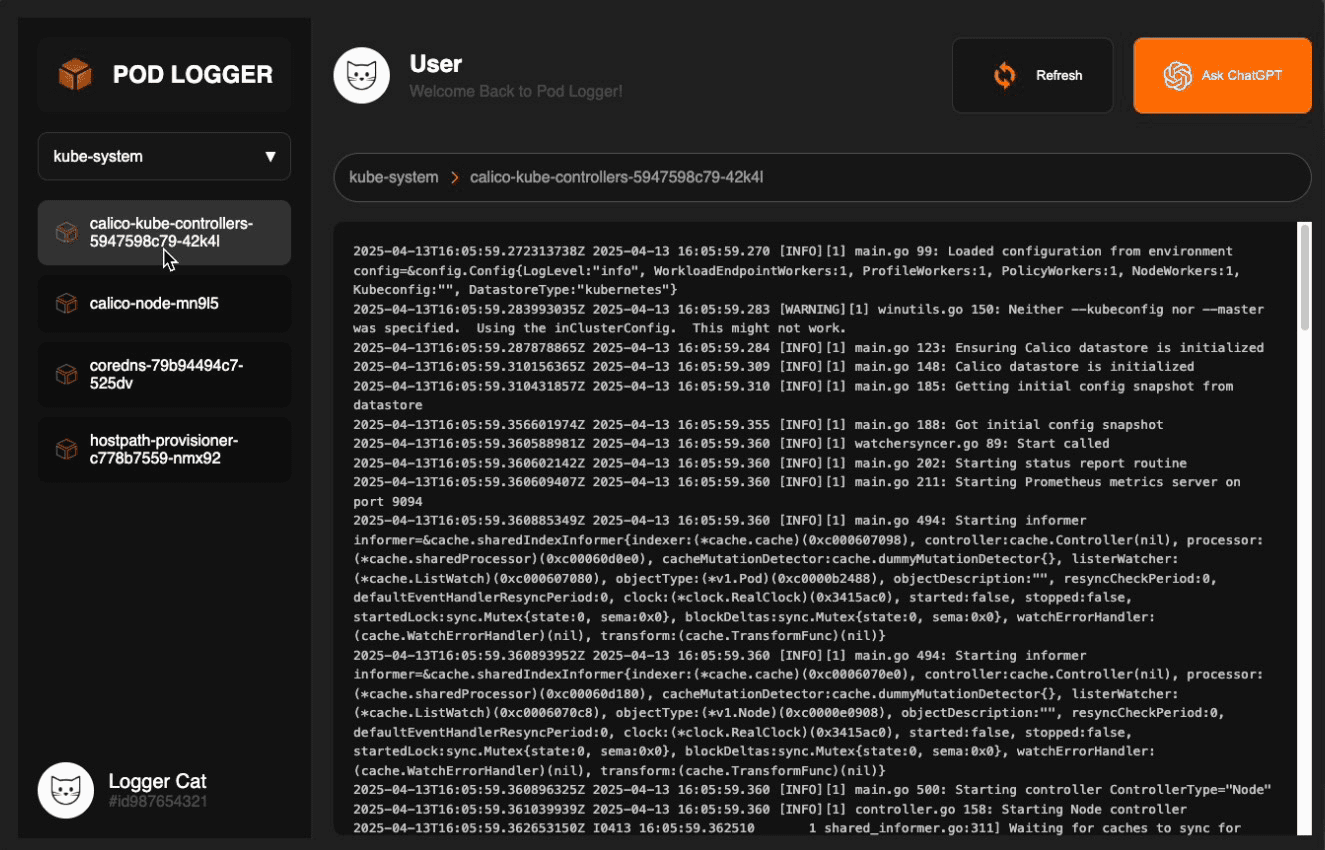
Adding a Dashboard with Builder.io and Design Collaboration
To give the app a more polished user interface, I teamed up with Sanskriti Gupta, who helped craft the design for a new dashboard. Using Builder.io, I built a visually appealing dashboard layout that could later fetch real data. The current dashboard uses dummy data, but it’s ready to be integrated with the Go API endpoints. Builder.io’s drag-and-drop interface made it easy to convert a design prototype into production-ready HTML/CSS components. The dashboard container was also dockerized and added to the docker-compose.yml setup. With the frontend and backend all running as separate containers, the system now felt modular and production-ready. Adding future features like log filtering, alerts, or even log storage would be much easier within this structured layout.
Finalizing Kubernetes Configs and Making Deployment Easy
Once the application was running smoothly with Docker Compose, I transitioned it to Kubernetes by creating a consolidated set of configuration files. Instead of defining separate deployments for the frontend and backend, I opted for a single pod manifest that ran both containers side-by-side in a multi-container setup. I also created ConfigMaps for managing environment variables cleanly and applied Role, RoleBinding, ClusterRole, and ClusterRoleBinding to ensure the backend container could securely access the Kubernetes API. These permissions enabled the backend to list namespaces, pods, and fetch logs directly from inside the cluster. After validating each component individually, I compiled everything, pods, configmaps, roles, bindings, and services, into one combined YAML file. This made deployment extremely simple, allowing anyone to deploy the app using a single curl command followed by kubectl apply -f -, with no need to manually edit anything. The final structure is clean, portable, and ready for production-like Kubernetes environments.
Final Touches: Nginx Config, Relative URLs, and Refresh Functionality
One last challenge was making sure that services could talk to each other inside Kubernetes without relying on localhost. I updated all frontend API calls to use the internal Kubernetes service names like http://api-service:8080 instead of http://localhost. I also edited the Nginx config to route traffic appropriately and avoid 404s on refreshes. The refresh button on the frontend was tied to JavaScript logic that hit the /api/logs endpoint every few seconds or on demand. With this, users could see the log update in near real-time. It helped validate that logs were truly coming from running pods and not cached or static. The end product is a clean, interactive logging dashboard that’s powered by Kubernetes, built using Go, and delivered via modern frontend tools.
Let’s try it!
Just head over to https://github.com/kaiwalyakoparkar/pod-logger or run the following commands inside your local terminal that has a connection to your Kubernetes cluster via kubectl
curl -LO https://github.com/kaiwalyakoparkar/pod-logger/blob/main/api/kubernetes/combined.yaml
Next, run this command to apply the Kubernetes pod configurations
kubectl apply -f podlogger.yaml
You should be able to access the podlogger dashboard at http://<your-cluster-ip>:30080

Thank you for reading ❤️
Thank you so much for reading this blog and joining me in this small side-project journey. The major aim of this project was to polish my Kubernetes knowledge and make something useful and fun that has medium complexity. I feel really nice as this project is towards the end of the idea that I had in my mind, and with all of your feedbacks, I will be working on more of the improvements into this. You can try out the project by heading over to my GitHub and following the steps I mentioned above